Picture the scene. It’s the quarterly board meeting, and the SEO update is slide 31 of a deck nobody planned to reach. It says organic traffic is up, 140 keywords moved into the top ten, and Core Web Vitals “improved.” A director asks, “So what does that mean for revenue?” The room goes quiet.
That silence is the real problem with most enterprise SEO reporting. The work may be solid. The report just answers questions the board never asked.
This guide covers what directors want from an SEO report, which metrics earn a place in it, and how to build a format that gets read instead of skimmed.
Board members skip SEO reports because they’re written in the team’s language (rankings, impressions, crawl stats) rather than the board’s language (revenue, risk, and decisions). A report gets read when it connects organic search to business outcomes within the first few lines.
SEO teams build reports for people who understand SEO. That’s natural, since the team lives in those tools every day. But a board member has maybe two minutes for your topic, and they’re weighing it against capital spending, headcount and regulatory matters.
Three habits usually cause the problem:
Reports are built around what the tools export, not around what leadership needs to decide.
Wins are reported as activity (“we published 60 pages”) instead of outcomes.
Bad news is buried, so the one thing a director should see is on page nine.
What Does a Board Actually Want From an SEO Report?
A board wants three things from an SEO report: proof that organic search contributes to revenue or leads, a clear view of risks such as traffic dependency or technical failures, and any decision or approval the SEO team needs from leadership. Everything else is supporting detail.
Think of it as three questions, in this order:
Is it working? Show organic contribution to leads, sales or pipeline, compared with the previous quarter and the same quarter last year.
What could go wrong? Flag concentration risk (for example, most organic revenue coming from a handful of pages), a migration coming up, or a competitor gaining ground on your highest-value topics.
What do you need from us? Budget, engineering time, a legal sign-off, a decision on a regional site. If nothing is needed, say that too.
If a section of your report doesn’t help answer one of these, it probably belongs in an appendix.
The Metrics That Belong in a Board-Level Report
Keep the list short. Five to seven numbers, each tied to money or risk, will do more than thirty charts.
Board-level metric
Why it matters
What it replaces
Organic leads or revenue (by business unit)
Shows contribution to the bottom line
Total sessions
Share of conversions from organic vs paid
Shows how much you depend on ad spend
Raw traffic growth
Visibility for revenue-driving topics
Shows whether you’re winning where it counts
Average position across all keywords
Branded vs non-branded split
Shows real discovery, not just existing awareness
Blended click totals
Technical health of key templates
Shows risk to pages that earn money
Total number of crawl errors
Market-by-market performance
Shows where investment is working or lagging
A single global figure
A few honest caveats. Attribution is never perfect. Analytics tools can undercount organic conversions or credit them to other channels, and Google Search Console doesn’t show every query. Say so in a footnote and keep the method consistent from quarter to quarter. Boards forgive imperfect measurement far more easily than they forgive numbers that keep changing definition.
Visibility in AI-generated answers is also becoming a fair question to field. Measurement is still rough and varies by tool, so treat it as an emerging indicator and label it that way rather than presenting it as a settled KPI.
How to Structure a One-Page Board Summary
A good board SEO summary fits on one page: a headline sentence, four to six key metrics with trend arrows, one paragraph on risks, and a short list of decisions needed. Detailed dashboards sit behind it for anyone who wants to dig deeper.
Here’s a format that works well in practice:
Headline (one sentence). Example: “Organic search produced a larger share of qualified enquiries this quarter, but two regional sites are lagging.”
Scorecard. Your handful of metrics, each showing current value, previous period and direction.
What changed and why. Two or three short bullets with plain-language causes, such as a product page restructure or a competitor launch.
Risks. One short paragraph. Be specific and name the page group, market or dependency.
Decisions needed. A numbered list with an owner and a date for each.
Write it so a director can read it on their phone between meetings. If the summary needs a verbal walkthrough to make sense, it’s too complicated.
A concise executive summary should retain the result that complicates the story, rather than hiding it.
Rankpage Case Study: How Rankpage’s Website Work Translates into a Clear Performance Story
Rankpage built an English-learning client’s full website, created localised content and designed useful tools for its users. That gives a performance report a concrete delivery story: a website supported by learning material and practical features.
The next step is to explain the numbers with the same clarity. Report what improved, acknowledge what moved the other way, and keep enquiries or commercial outcomes separate until their records are available.
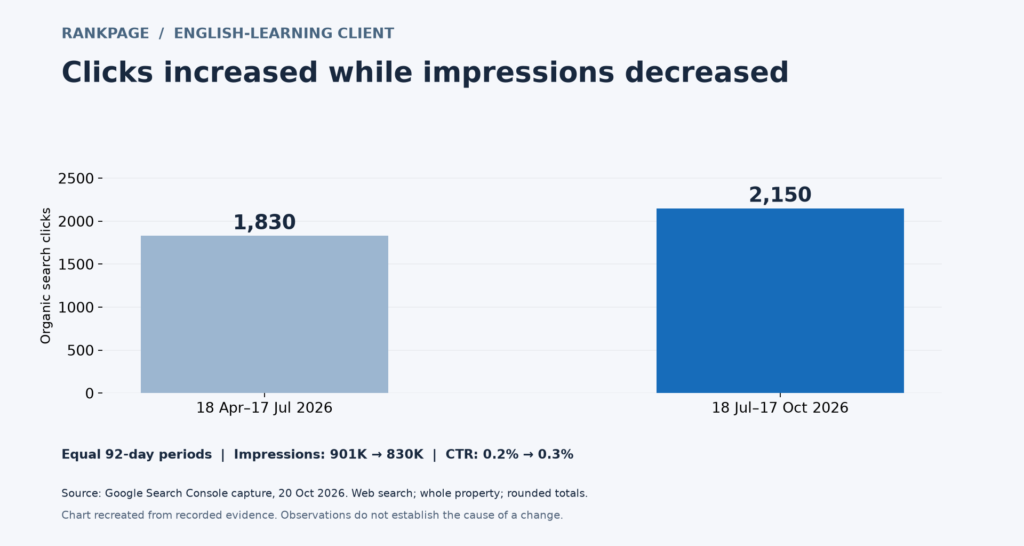
The client’s GSC comparison recorded approximately 1,830 clicks in 18 April–17 July 2026 and 2,150 in 18 July–17 October—around 17% more clicks across equal 92-day periods. Reported CTR rose from 0.2% to 0.3%, while impressions fell from 901,000 to 830,000. The useful headline is more search clicks alongside a lower impression total—not a claim that every visibility measure or business outcome improved.
Figure: Whole-property GSC clicks across two equal 92-day periods; impressions moved in the opposite direction.
Source: Rankpage client evidence: anonymised GSC comparison captured 20 October 2026; equal 92-day periods and rounded dashboard totals.
Building the Reporting Layer Underneath
The one-pager only works if the data behind it is trustworthy. That’s where large organisations struggle most, because the data is scattered across business units, markets and teams that each measure things slightly differently.
This is also where proper enterprise SEO reporting earns its keep. Instead of one blended number, you want performance tracked by segment, region and business unit, so leadership can see which parts of the organisation are pulling their weight and which aren’t.
If you’re short on in-house capacity, an agency such asRankpage, a Malaysian SEO agency that offers enterprise-level services, can help set up that reporting structure alongside the technical and content work.
Segment By Business Unit And Market
A group with several brands or country sites should never report one aggregate figure. Averages hide the story. One market may be growing fast while another quietly shrinks, and the total looks fine.
Break results out by the same structure the board uses to review the business. If directors think in terms of divisions, report by division. If they think in terms of countries, report by country.
Agree On Definitions Before The First Report
Before you send anything, get marketing, finance and sales to agree on a few terms:
What counts as an organic lead?
Which conversions are included?
How are branded searches separated from non-branded?
What’s the comparison period?
It sounds dull, but it prevents the most damaging boardroom moment of all: two executives disagreeing about whether the number is even right.
Common Mistakes That Make Reports Unreadable
Leading with rankings: Rankings are an input, not a result. Start with outcomes.
Changing metrics every quarter: Trends only mean something if the yardstick stays put.
Reporting everything: A long report signals that you haven’t decided what matters.
No stated risks. If every report is positive, directors stop trusting any of them.
Jargon without translation: If you must mention “crawl budget” or “canonicalisation,” explain the business impact in the same sentence.
A Realistic Scenario
Imagine a Malaysian group with three consumer brands and regional sites in Malaysia, Singapore and Vietnam. The original SEO report was a 40-page deck with one blended traffic chart. Directors gave it two minutes at most.
The rebuilt version opened with a single page: organic enquiries by brand, a note that Vietnam was underperforming because of thin localised content, and one request, which was budget for local copywriting. The detailed dashboards stayed available behind a link. The board approved the request in the same meeting, because they finally had something to approve.
FAQ
What is enterprise SEO reporting?
Enterprise SEO reporting is the structured tracking and presentation of search performance across large websites, multiple markets and several business units. It links organic search activity to business results like leads and revenue, and it’s designed for executives as much as for SEO specialists.
How often should SEO be reported to the board?
Quarterly is usual for boards, with monthly reports going to senior management. The cadence should match how often the board reviews other performance data. Any urgent risk, such as a major traffic drop after a site migration, should be raised immediately rather than saved for the next meeting.
Which SEO metrics matter most to executives?
Organic leads or revenue, organic share of total conversions, visibility on revenue-driving topics, and the technical health of key pages matter most. Executives care less about total traffic or average rankings, because those figures don’t show whether search is contributing to growth.
How long should an SEO board report be?
One page for the summary, with an optional appendix. The summary should hold a headline, a few key metrics, main risks and decisions needed. Anyone wanting detail can open the dashboards, but the board shouldn’t have to in order to understand the situation.
How do you connect SEO to revenue?
Track organic conversions through analytics and CRM data, agree on definitions with finance, and report leads or sales by business unit. Be open about attribution limits. Consistent methodology over time matters more than a perfect single number.
Conclusion
Good enterprise SEO reporting isn’t about showing more data. It’s about showing the right five or six numbers, naming the risks plainly, and asking for the decisions you need. Do that consistently and the SEO update stops being slide 31 and starts being a conversation leadership looks forward to.
If you’re rebuilding your reporting or want a second opinion on what your board should be seeing, a short audit of your current setup is a sensible place to start.