
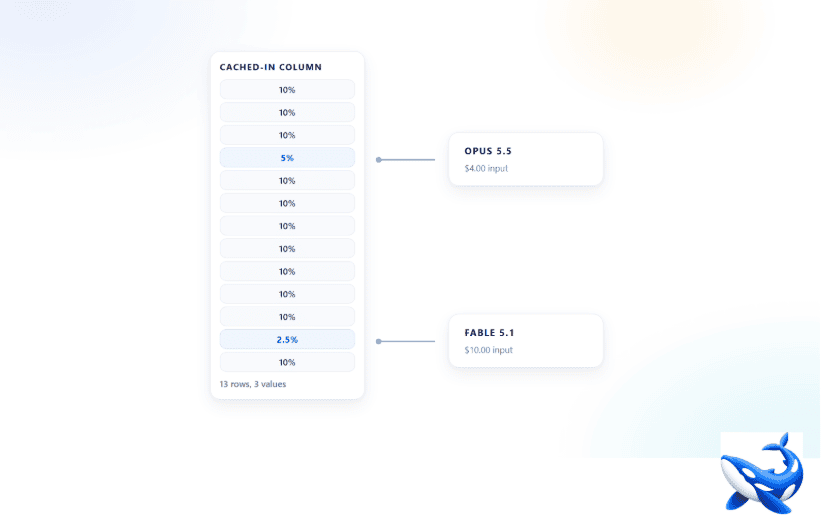
Eleven of the thirteen rows on the OrcaRouter anthropic models page print the same figure in the cached-input column, and the two rows that do not are the two a reader would have picked out anyway [VENDOR, read 2026-10-14]. That is not how the other six provider catalogues on the site behave. They spread the cached rate across a range of fractions and leave you to compute each row. This one pins eleven rows to a single number and then breaks it exactly twice, and the two breaks fall on the two most distinctive rows on the page.
A column that takes three values is a column you can read in one pass, which is why the exceptions are worth attention. So the useful question is not the average discount — there is no average, there are three — but which rows were singled out and why the arithmetic singles them out in opposite directions.
The column that only takes three values
The catalogue lists thirteen models. Twelve of them are billed per token on the same three columns; one page-header statistic says the cheapest input rate here is $1.00 per million tokens, and the dearest row on the page is ten times that at $10.00 [VENDOR, read 2026-10-14]. The cached-input figures span almost exactly the same factor — from $0.100 to $1.00. Two columns of equal range, then, and yet the ratio between them, read row by row, collapses into three numbers.
| Model | Input | Cached in | Cached share of input |
| Claude Fable 5 | $10.00 | $1.00 | 10.00 % |
| Claude Fable 5.1 | $10.00 | $0.250 | 2.50 % |
| Claude Opus 4.7 | $5.00 | $0.500 | 10.00 % |
| Claude Opus 4.8 | $5.00 | $0.500 | 10.00 % |
| Claude Opus 5 | $5.00 | $0.500 | 10.00 % |
| Claude Opus 4.6 | $5.00 | $0.500 | 10.00 % |
| Claude Opus 4.5 | $5.00 | $0.500 | 10.00 % |
| Claude Opus 5.5 | $4.00 | $0.200 | 5.00 % |
| Claude Sonnet 5 | $2.00 | $0.200 | 10.00 % |
| Claude Sonnet 5.5 | $2.00 | $0.200 | 10.00 % |
| Claude Sonnet 4.6 | $3.00 | $0.300 | 10.00 % |
| Claude Sonnet 4.5 | $3.00 | $0.300 | 10.00 % |
| Claude Haiku 4.5 | $1.00 | $0.100 | 10.00 % |
Every rate in the first three columns is vendor-published and read 2026-10-14 [VENDOR]; the right-hand column is arithmetic performed on the other two, not a figure the page prints.
Read the right-hand column as a distribution and the distribution has three points in it. Eleven rows sit at ten per cent — across four price levels, four generations and three model families, the fraction does not move at all. That is a plan rather than a price list. A catalogue that priced each row independently would produce a smear of fractions; this one behaves as though someone decided the cached rate would be a fixed tenth of the input rate and then charged on that basis, which is a different kind of document from a table of quotes.
The two rows that break the pattern
The first break is Claude Opus 5.5 at five per cent, and the row explains itself the moment you look across at the input column. It is the only $4.00-input row on the page. Every other Opus-class model here is $5.00, and every one of those caches at $0.500 — a tenth. Halve the fraction on a $4.00 row and the cached rate comes out at $0.200, which is exactly what the table prints, and which is also the same absolute figure that the two Sonnet 5 rows carry on a $2.00 input. So the absolute cached figure is shared across rows that have nothing else in common, and it is the fraction rather than the figure that is being managed.
The second break runs the other way. Claude Fable 5.1 caches at $0.250 against a $10.00 input rate — two and a half per cent, the shallowest discount on this catalogue and the second-shallowest anywhere on the site. It also happens to sit on the dearest row in the catalogue, which means the model with the largest headline price has the least to gain from a repeated prefix. If you were choosing a row for a workload built around a long frozen document, the pricing table points away from the flagship and toward the eleven rows at the ten per cent convention, and it does so using a column most readers never get to.
One row that differs from its twin in a single column
Claude Fable 5 and Claude Fable 5.1 are worth putting side by side, because they are the cleanest test of what the cached column is for. They share an input rate of $10.00, an output rate of $50.00, a one-million-token context window, a 128K maximum output and a quality score of ten [VENDOR, read 2026-10-14]. Five columns identical. The sixth — cached input — reads $1.00 on one and $0.250 on the other, a factor of four between two rows that are otherwise the same row twice.
That is either a very large difference or a very small one, and which it is depends entirely on a number neither the table nor the model page asks you for: how much of your input is a repeat of input the provider has already seen. A workload with no repeated prefix never touches the column and the two models are identical in cost. A workload whose request is nine tenths frozen prefix pays $0.250 per million on nine tenths of its input tokens instead of $1.00, and the difference between the two rows stops being a rounding detail and becomes the largest single term in the comparison. Before you have measured that share, the column tells you nothing about which row is cheaper. After you have measured it, the column is the only one of the six that was ever going to change.
The calculator spends the discount
Below the pricing table the page carries a cost calculator, and it does the same thing every other calculator on this site does: it assumes a cached share and does not print it. Set it to ten million tokens a month with seventy per cent of the volume as input, on Claude Opus 4.7, and it returns $110.00 for the uncached case and approximately $94.25 with prompt caching [VENDOR, read 2026-10-14].
Both numbers check out against the table above, and checking them is the whole exercise. Seven million input tokens at $5.00 is $35.00; three million output tokens at $25.00 is $75.00; $110.00 exactly. The cached line drops the input term to $19.25, a saving of $15.75 — which is forty-five per cent of the input term, and which can only be produced by the $0.500 cached rate from the ten per cent band. Hold the output term fixed and solve for the share the widget must be assuming, and the answer is exactly half of all input tokens. The calculator silently assumes a fifty per cent cache-read share, and it is the same fifty per cent the Grok widget assumes, which makes it a convention of the platform rather than a quirk of one page.
A cache-write rate no column prints
There is one more number in this catalogue’s data layer, and it appears on none of the seven provider tables. The Claude Fable 5 model page ships a tier object carrying both a read and a write figure for cached tokens, and while the read figure matches the provider catalogue at $1.00, the write figure is $12.50 per million tokens [VENDOR, read 2026-10-14]. That is one and a quarter times the row’s $10.00 input rate.
Read that as a surcharge rather than a discount, because that is what it is. Filling the cache on this row costs more than sending the same tokens uncached, and only the subsequent reads come back at a tenth of the input rate. The break-even is therefore a function of how many times a prefix is reused, not of how long it is: the first pass pays a premium and each later pass repays part of it. The page’s rendered tier table does not appear on that model page at all — the figures live in the data layer only — and no provider catalogue on the site carries a cache-write column, so a reader comparing rows on the visible columns is comparing a discount without seeing its entry fee.
The same column across the rest of the site
Set this catalogue against the other six and its position is easy to state. Ninety-four rows across the seven provider pages carry a cached rate, and the shares run from two per cent of a row’s own input rate to fifty per cent — a factor of twenty-five end to end [VENDOR, read 2026-10-14]. Anthropic occupies the shallow third of that range. Its steepest discount, the ten per cent eleven rows share, is well below the site maximum and is in fact the most common single fraction on the platform: large parts of the OpenAI and Kimi catalogues cache at the same tenth. Its shallowest, the two and a half per cent on Claude Fable 5.1, sits close to the site minimum, which belongs to a DeepSeek row at two per cent.
So the interesting thing about this column is not its range, which is unremarkable, and not its generosity, which is average. It is the consistency. A ten per cent convention applied to eleven rows out of thirteen, broken once by a row priced a dollar below its family and once by a row priced double the cheapest thing on the page, is a column you can hold in your head — and it is also the only column on the page that distinguishes Claude Fable 5 from Claude Fable 5.1 at all.
The takeaway
Read the cached-input column here as a policy rather than a set of quotes: a fixed tenth almost everywhere, five per cent where the input rate steps down to $4.00, two and a half per cent on the $10.00 rows’ newer sibling. The practical consequence is that the cheapest rows to repeat are not the cheapest rows to call — the ten per cent band runs all the way down to Haiku 4.5, and the row with the shallowest discount is the most expensive one on the page. Compute your own cache-read share before comparing any two rows here, because until you have, the two Fables are indistinguishable, and afterwards the column you skipped is the only one that ever mattered. The FAQ answer naming Claude Haiku 4.5 at $1.00 per million input as the cheapest model here matches the header statistic exactly; it simply does not tell you which row to pick once your prompt starts repeating.
Sourcing note: every input rate, output rate, cached-input rate, context window, maximum output and quality score cited is vendor-published and read 2026-10-14 [VENDOR]; the thirteen cached shares, the four-fold gap between the two Fable rows, the site-wide ninety-four-row range from two to fifty per cent and the twenty-five-fold factor are arithmetic performed on those published rates, not separate measurements. The $110.00 and approximately $94.25 calculator outputs are vendor-published figures read 2026-10-14 [VENDOR]; the fifty per cent cache-read share behind the cached line, and the identification of that share with the Grok calculator’s, are derived here by arithmetic rather than stated by the page, and are marked [OURS]. The cache-write figure is read from the model page’s own data layer, which is the only place on the site it appears [VENDOR]. Quality scores are OrcaRouter’s own composite, assembled from production traffic and published sources, not a third-party benchmark. The header statistics and the FAQ answer naming the cheapest model are read from the page itself [VENDOR].
